In most modern systems based on either a resistance pad and a load sensor (where the position of the lever arm is adjustable like the Kin-Com AP) or where torque is derived from turning force at the actuator axis (like in the Cybex / CSMI Norm, Biodex system 4 pro, Isocom, BTE, Contrex and Isomed), the following is true:-
Strength Testing:
Force:
Used on older machines (Kin-Com) force is normally measure in imperial measures as pounds (lbs) or metric as newton meters (NM).
- LBS: Originally from the UK measured now in the USA as a avoirdupois pound. This is equalto 16 avoirdupois ounces (exactly 7,000 grains an (international) grain is equal to exactly 64.79891 milligrams).
- KG: Being the only metric measure taken from a physical mass the kilogram is defined as being equal to the mass of the International Prototype Kilogram (IPK), which is equal to the mass of one liter of water.
Torque:
All modern dynomometers (Cybex / CSMI Norm, Biodex Pro 4, Con-Trex, BTE)
Force is actually measured as torque which is the turning effect (moment) of a given force on an object. Torque = moment x distance from turning centre (in this case the centre of rotation of the lever arm).
- Ftlb: An imperial measure (used in USA) is the energy transferred on applying a force of 1 pound-force (lbf) through a displacement of 1 foot.
- Nm: A measurement of torque often called moment instead. One newton metre is equal to the turning force of one newton (1 kg) applied to a moment arm which is one metre long.
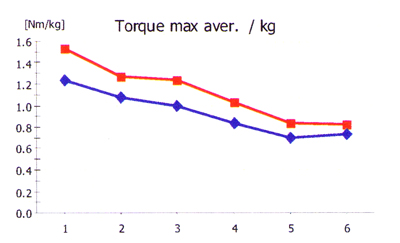
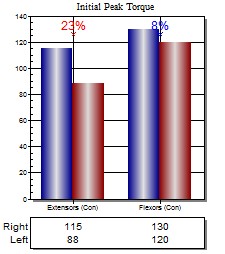
Peak Torque:
The maximal value of the momemt angle position (MAP) curve (the peak torque is the highest point on the curve). This is considered to be the gold standard measure in isokinetic testing / exercise (Kannus 1994).
Mean Torque:
Sum of peak torque measured over IROM / number of measurements.
This is often used to describe strength and is seen as a less meaningful variable (as fatigue plays a great role in the determination of this figure).
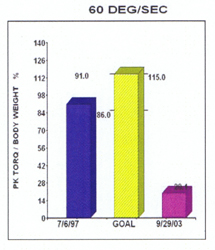
Peak torque to weight ratio:
To compare results between individuals peak moment is calculated compared to body weight (either kilos or pounds). Lower limb strength is dependent on body weight and can be expressed in this way. Upper body strength is less dependent and is not usually described this way.
Time peak torque held:
Normally used in isometric testing the amount of time peak torque was held
Time to half peak torque:
Isometric reports only this is the time from the beginning of torque development to the point where the torque is half the peak torque.
Peak torque slope:
Used in isometric testing it is the peak torque divided by the time to reach peak torque.
Force decay time:
Normally used in isometric testing this is the time from the end of peak torque production to the end of the motion.
Average Torque:
Used in isometric testing and normally replaces work. It is the average torque during an isometric contraction.
Angle specific torque:
Used to determine a specific angle torque relationship which may be of interest (for instance when looking at agonist/antagonist con/ecc ratios). It has been shown (Kannus and Kaplan 1991) to be most reliable in middle joint ranges with decreasing reliability at the extremes of motion.
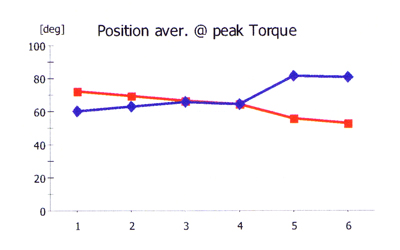
Angle of peak torque:
As the name suggests (but often called angle of occurrence) this is when peak torque reaches it’s maximum level. It can be useful as an indicator of maximum torque production if plotted against various velocities (Osternig 1986). Weaker muscles (probably due to neuromuscularfacilitation) show peak torque later in range (for individualranges see individual joints) as has been demonstrated by Kannus and Jarvien (1990). The reliability of this measure is often very low (Kannus 1994) and is made worse by repeated tests (due to alignment problems, Chan and Maffulli 1996)
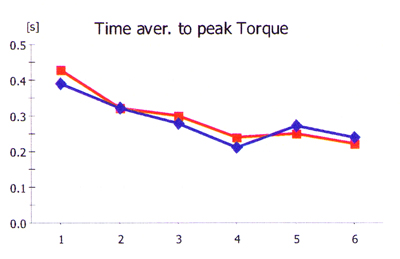
Time to peak torque:
Evaluates the ability to produce force rapidly and can be used to determine explosive power. A prolonged time to peak torque can indicate reduced recruitment of type II fibers (Kannus 1994). This has been superseded by peak torque acceleration energy.
Peak torque acceleration energy:
Amount of work performed in the first 125 ms of a torque production cycle. This is supposed to reflect explosive power as it assesses the speed and rate of torque production. As an accurate measure it is very variable at slow speeds (Kannus 1994) and can be greatly affected by exercise cycles i.e. if there is no pause between con/ecc cycle then the results are usually useless. Ecc/ecc and con/con exercises produce best results, however, even these have been questioned as they may not (according to Perrin et al 1989) have a basis in Newtonian physics.
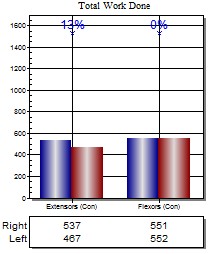
Contractional Work:
All described in standard international units Joules (J) which is a measure of energy and work (rather than force). It is equal to the energy expended (or work done) in applying a force of one newton through a distance of one metre (1 newton metre or N·m),
A measure of the energy expended by the muscle/s under test and considered by some authorities to reflect endurance. However, difficulties in assessing the importance of strength (or lack of) and endurance during the interpretation of these results makes their use questionable for research purposes but good for rehabilitation.
W(ork) = torque x angular displacement
Total work (TW) = Area under torque curve x angular displacement (according to Hislop and Perrine 1967)
Work per repetition = Work done in each repetition
Peak power (PP) = work done during the best repetition (often called best work repetition BWR)
Max rep total work = the total work achieved in the repetition with the highest peak torque.
Work first third = the total work in the first third of the test
Work last third = the total work in the last third of the test
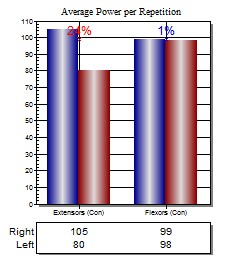
Power:
W(ork done) / T(ime taken) = P(ower) Power then is energy divided by time. The unit of power is the watt (W), which is equal to one joule per second.
Power relates to the average time rate of work. Power does not decline with increasing velocity as peak torque does during concentric contractions instead it increases (Osternig 1986). The use of this measurements is limited mainly because the results can be obtained from the peak torque to time figures. These measurements can highlight differences between elite performers when peak torque figures appear fruitless (Kannus 1994)
Contractional Impulse:
Moment (average) x T(ime) = I(mpulse)
Used in literature to describe the difference in performance where the peak torque reveals no differences.
Reciprocal Delay:
The time required to reverse the limb direction.
Delay time:
The time from the beginning of motion to the beginning of torque development
Acceleration time:
The time taken to accelerate to isokinetic speed.
Deceleration time:
The time taken to decelerate from isokinetic speed back to 0.
Coefficient of variation:
The amount of difference between the reps in an individual set. This variable is used to check the consistency of a set the closer the result is to 0 the more consistent the set. In strength tests this should be below 0.20 (Dvir 1995) if the test is to be valid. A high figure is expected in endurance testing. In isometric and isokinetic tests the deviation is worked out from torque whilst in isotonic tests the deviation is from position.
Agonist antagonist ratio:
The peak torque of the weaker muscle group divided by the peak torque of the stronger muscle group then multiplied by 100 to give a percentage. The weaker group is shown as a ratio of the stronger one.
Fatigue and Endurance Testing:
Initial peak torque:
The average of the first three reps of an endurance test
Final peak torque:
The average of the final three reps of an endurance test
Fatigue index:
combining the above two measures this is the percentage that peak torque declined during the endurance test. It uses a simple Chi-Squared test by subtracting initial peak torque from final peak torque then dividing that by the initial peak torque again this is then multiplied by 100 to give a percentage out of 100. Note a negative number means the subject got stronger during the test not weaker.
Endurance or Fatigue ratio:
The ratio of total work from the first half of the set divided by the work from the last half of the set multiplied by 100. This is a more reliable fatigue measure.
Declined Work
The most widely used endurance measure. The amount of work performed over a set number of repetitions is recorded. These tests have been said to be absolute endurance measures which should be used in research settings (Kannus 1994). The trouble starts when subjects can not reach the set number of repetitions required.
Time to 50% of peak torque.
The amount of time it took took to reach 50% of the initialpeak toque values. The actual percentage can often be altered (Cybex Norm) with 40% becoming a popular number used.
Work to 50% peak torque:
The amount work produced up to the point where torque levels fell below 50%
Power to 50% peak toque:
The power produced before peak torque fell below 50% maximum
Other Measures:
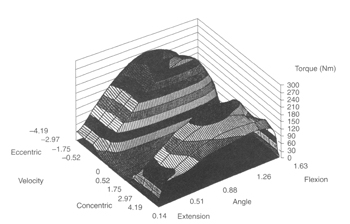
Isomap:
Biodex systems 3 and 4 use Isomap as a type of report. In essence an isomap looks at torque and position like an ordinary MAP curve but it then adds speed (3 speeds are tested and shown) to the equation which produces a coloured ‘map’ showing deficits in strength or speed production both related to angle. In the deficit map red areas show problems whilst blue areas are OK.
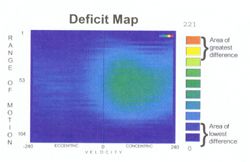
Isomap is a mathematical model uses low-dimensional embedding methods, where geodesic distances on a weighted graph are incorporated with metric multidimensional scaling. The algorithm provides a simple method for estimating the intrinsic geometry of the torque and position data based on a rough estimate of each data point’s neighbors in relation to speed.
Comparison Speed Controlled:
Con-Trex uses a 3D model of a standard MAP curve with position on the X axis and Torque on the Y axis. Speed is then added on the Z axis with up to 6 different speeds available for plotting. Colour is then added to distinguish deficits through the range and speeds.
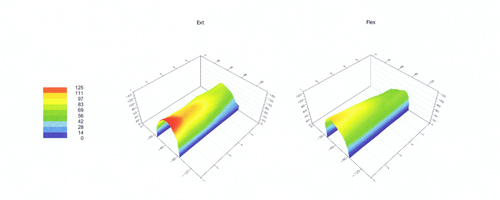
3D muscle mapping:
Originally developed by NASA 3D muscle mapping takes the standard MAP curve (force on the Y axis position on the X axis) and simply adds speed to the Y axis. This allows the performance of any muscle to be viewed as a terrain map showing peaks and troughs. It is elegant simplicity.