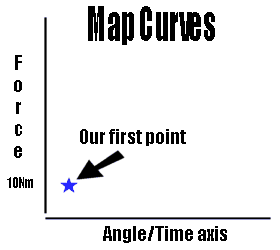
In isokinetics (and isometric contractions) a MAP curve is produced whenever a subject pushes against the pad/attachment on the lever arm (no matter how hard). They represent the various force points the machine records, so if you test your subject’s knee and they push 10Nm at the beginning of the range of motion, then a point will be placed on a graph at the relevant angle/time axis (see below).
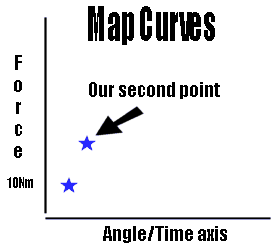
If the subject then pushes slightly harder (say 20Nm) as they progress through the range of motion, we get a second point (see below) but this will be further into the movement (greater angle) or after the first recorded point (later on the time axis).
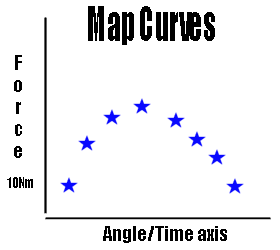
Following on from this we would probably get various readings throughout the movement giving us allot of points (see below).
If we then drew a line through the points we would have a MAP curve. As we have plotted the moment (force/torque) against the angle (joint/actuator) and this gives us the position! We get one curve for each contraction.
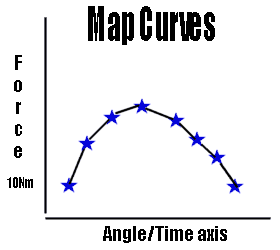
Remember most isokinetics machine plot one hundred point every second (some like the Humac Norm plot 2000 per second) so the amount of points you get depends on the range of motion and the speed the machine is set at.
In isotonics force is replaced by velocity but the principle is the same.