Biodex systems 3 and 4 use Isomap as a type of report. In essence an isomap looks at torque and position like an ordinary MAP curve but it then adds speed (3 speeds are tested and shown) to the equation which produces a coloured ‘map’ showing deficits in strength or speed production both related to angle. In the deficit map red areas show problems whilst blue areas are OK.
Isomap is a mathematical model uses low-dimensional embedding methods, where geodesic distances on a weighted graph are incorporated with metric multidimensional scaling. The algorithm provides a simple method for estimating the intrinsic geometry of the torque and position data based on a rough estimate of each data point’s neighbors in relation to speed.
Signorile and Applegate (in Brown 2000) create a good case for using 3D muscle mapping technology to asses muscular performance.
In reality isokinetics users of a high standard tend to use the 3rd dimension anyway.
The third dimension is in fact different speeds.
We all probably do a version of isomapping each time we test a subject by testing at different speeds and looking closely at the results it is apparent where there are major flaws in muscle performance. Well isomap takes this one stage further by allowing us to see small differences in muscular performance at different speeds.
When we test two different limbs we can look at the map curve and see if the maximal torque values are the same and whether they occur earlier or later through the range. This can then be used to separate elite athletes from amature athletes and can also be used to asses the degree of pathology in the patient.
With isomap the process is taken on step further by allowing us to see not only this difference but also any differences at many different speeds.
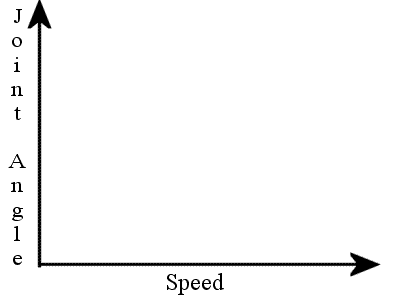
As we can see on the plane graph above the vertical axis is used to plot the joint angle whilst the horizontal axis is use to plot the speed of movement (remember you test at many different speeds say 50 then 80 then 120 then 140 degrees per second and the computer fills in the blanks).
The map is usually then split on the horizontal axis again into contraction type i.e. concentric/concentric or eccentric/eccentric (see below)
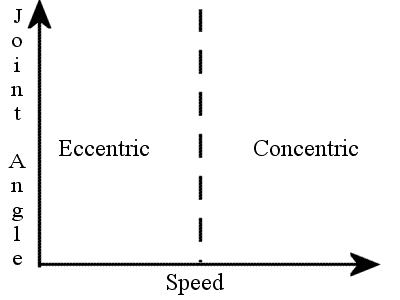
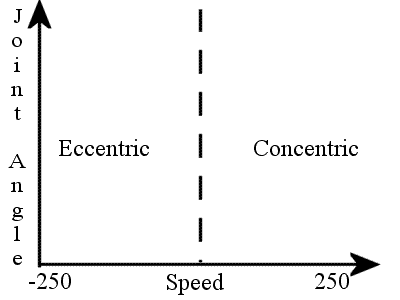
To confuse matters sometime the eccentric phase will be expressed as a negative velocity whist the concentric phase will be described as a positive velocity e.g.
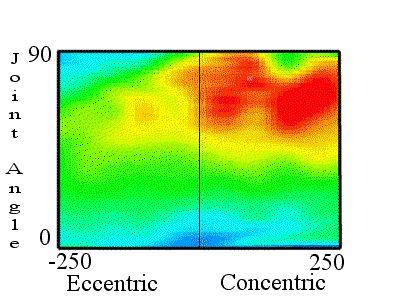
A bicubic interpolating spline is used to generate a 50×50 matrix of moment values which in short means they then put the strength values at each angle through joint range on to the map (in pretty colors) and match these values to their speeds (remember we tested at several different speeds) to fill in the gaps the math is used and this gives us a colorful 3D muscle performance map like so:
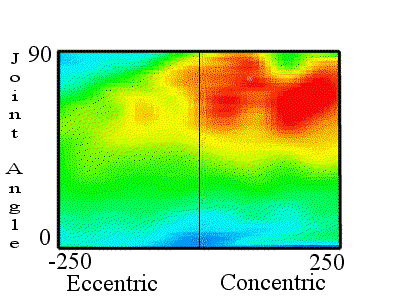
In our example red is high strength whereas blue is low strength. As this is only an example the principles of isokinetic test interpretation have been thrown out of the window. Here we can see our subject (lets say they are doing a knee test for the quads) demonstrates high strength at 90 degrees of knee flexion shown in red and is stronger concentrically than eccentrically. The strength is maintained with increasing speed concentrically (look at the way the red band continues with increasing speed concentrically) and the strength decreases eccentrically with increasing speed (as I said this example does not fit the expected pattern).
We could then put the opposite leg against the leg shown above:
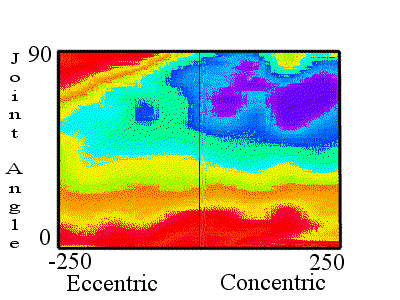
In stark contrast we can now see that in fact the other leg is weakest concentrically at higher joint angles but does maintain it’s strength throughout the speeds. Eccentrically the quads are strongest at low joint angles but get stronger at higher angles with increasing speed.
I must emphasize that the above are examples and are not meant to represent real isomaps they are simply to teach you how to read an isomap!!!
If these two graphs were seen in the rehabilitation setting the affected leg would be trained until the muscle performance characteristics more closely matched those of the unaffected leg (or in other words you would send them away with exercises that worked the muscles in the affected ranges at the affected speeds or there about until the colors matched).
In the sports science filed you would look for the differences between athletes in the same sport and try to improve the lower level athlete to the colours of the higher level athlete (remember not all sports are strength dependent!!)