Until the late 1970s 75% of all isokinetic use and research was based on a single joint system – the knee. With more recent progress in rehabilitation and knee surgery this trend no longer exists. The basic design of isokinetic dynamometers (except for special purpose units) has not changed since the original instrumentation became available in the 1960s. The design is still better suited for knee testing and rehabilitation than any other joint (Dvir 1995). Although the knee has 2 major articulations the relevant one in this section is the tibio-femoral component.
Testing and exercise are generally performed in the sitting position although absolute hamstring testing is best performed in the prone lying position as this allows a greater range of motion and functional testing is best performed in the standing position. However, flexion and extension can be performed in either the Seated (most popular), Prone lying, Supine lying or standing positions.
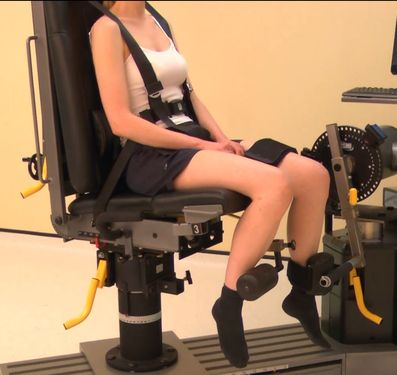
Seated position:
The most stabilised position for testing extension and flexion but it limits flexion unless the subject can get very close to the edge of the seat. Best overall position.
Seated testing assumes that minimal femoral motion will occur as the chair and body act as distal stabilisers of the thigh.
The subject usually sits with their back and thighs supported making approximately a right angle at the hip.
The subject usually sits with their back and thighs supported making approximately a right angle at the hip.
This position then allows maximal extension (although debate rages over whether extension beyond -20 degrees should be permitted. Do not test beyond 0 degrees extension as an absolute maximum, subjects tend to find limitations beyond 5 degrees irritating and tend to do large isometric contractions to try to complete the range so try to stick to 0 degrees if possible. Although the angle of seat recline (from the semi-reclined to the upright position, i.e. 40-90 degrees), has little effect on quadriceps strength it has significant effects on hamstring strength. The optimal position is approximately 80 degrees (with a corresponding change in seat angle recline to give 90 degrees at the hips). This optimal position is suggested for both extensors and flexors as it allows the collection of good data over the least time.
To view a set up video see below:
Standing position:
In the standing position stabilization is difficult if not impossible (and probably undesirable). Testing in this position is more functional than that in the seated position.
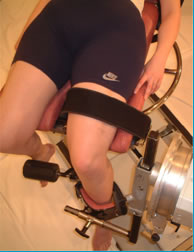
Prone lying position:
Prone allows for a much broader range of motion to be assessed. This position is generally used if the hamstring muscles are of particular interest (as stabilization of the knee flexion movement is easily achieved in this position). Stabilization is accomplished by allowing the subject to hold the seat edges and a femoral and waist strap should be applied. On the Cybex norm the seat does not lock into the down position this means that as the subject works the seat will raise up and crash back down. This can be prevented in the short term by wrapping the waist belt around both the patient and the chair. This appears to be an oversight on this machine. Best for hamstring tests.
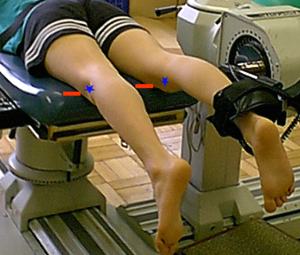
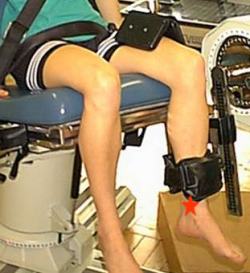
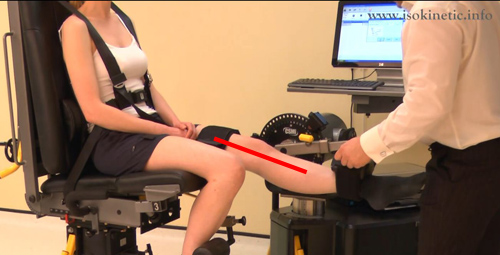
The subject is prone and the thigh support extends to allow the knee to be off the edge of the seat. The seat can be seen as the red line whilst the blue stars represent the joint line.
To view a set up video see below:
Supine lying position:
Supine allows for the focus of the test to be on rectus-femoris. In essence it is the same as seated but with the chair made into a bed. This is the least used position. Supine testing assumes that minimal pelvic and femoral rotation will occur will occur as the chair and body act as distal stabilizers of the thigh, however, the subject will often shift the pelvis (hip hitching) to gain a better leaver advantage. 90 degrees of knee flexion is needed in this position so you can obtain the peak torque measurement at the optimal angle of peak torque for the rectus femoris.
Stabilisation:
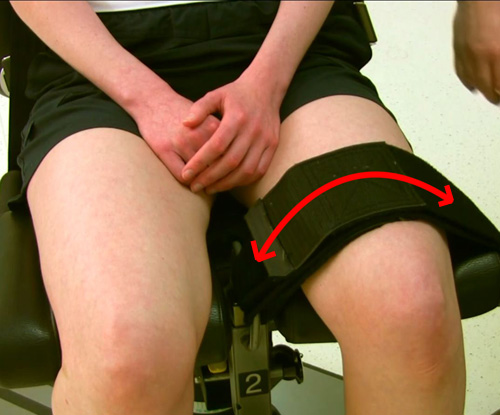
Seated: Stabilization is normally accomplished using femoral and pelvic strapping, however, the optimal set-up is a bit more involved. The number of research papers available on the subject is incredible. Magnusson et al (1992) showed that stabilization with a thoracic strap and the hands was associated with the highest quadriceps strength whilst no stabilization produced the lowest score. Hart et al (1984) also showed the use of a thoracic strap to improve quadriceps strength, whilst Hanton and Ramberg (1988) found exactly the opposite. Use of a thoracic, pelvic and femoral strap decreased quadriceps strength when compared to minimal stabilization i.e. only gripping the sides of the testing table.
Interestingly, Currier (1977) whilst testing isometric strength found that gripping of the table increased strength whilst gripping of handles did not show such significant improvements. These results were elaborated upon by Bohannon (1986) when he tested various gripping devices compared to only gripping the table and found massive differences. Hence, most isokinetic dynamometers do not offer hand grips as an option.
Prone Lying: Stabilization is normally accomplished using femoral and pelvic strapping and the subject is allowed to hold the chair or the handles provided.
Standing: Stabilization is almost impossible and would be undesirable as this position is the most functional.
Supine: Is normally accomplished using femoral and pelvic strapping and the subject is allowed to hold the chair or the handles provided.
Attachments:
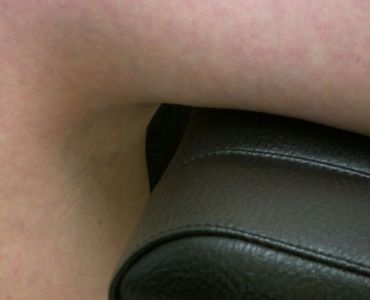
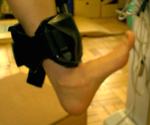
Whilst testing normal subjects the resistance pad is placed on a level with the inferior part of the pad immediately superior to the medial malleolus shown here (in other words the bottom of the pad touches the top of the medial malleolus). This is because 70% of all subjects tested by Kramer et al (1989) found this the most comfortable with the other 30% preferring a position at two-thirds of the usable leg length (after you have spent an hour determining the usable leg length and then calculating a position two-thirds down this, your subject will be so fed up the results will be negated by poor subject motivation).
When using any selected location the subject should be free to maximally dorsiflex the foot (as seen below).
Close attention should be paid to not over tightening the strap around the shank as the resistance pad will, in all subjects, slide up and down the leg to some degree (this is because of the change in joint axis through range).
Siewert et al (1975) showed that the strength of both the extensors and flexors become successively smaller as the resistance pad is placed near the knee. This trend was established at all test velocities. Taylor and Casey (1986) have suggested that the reason for this phenomenon was increased intra muscular pressure which causes further divergence of the knee axis away from the actuators axis (or in other words the axis of knee rotation becomes greater which means that the axis of rotation you set at the machine must be further away from it). For every 1cm change an alteration of up to 5% in the values recorded can be expected.
These findings were supported by Kramer et al (1989) however, it is probably not that simple. Moving the resistance cell nearer the knee also shortens the dynamometer application arm and increases the angle between the arm and shank which when coupled with changes in neurophysiological inhibitory mechanisms, discomfort and pain all contribute to a general reduction in muscular strength.
Consistency in the position of the resistance pads is, therefore, crucial.
Axis of rotation:
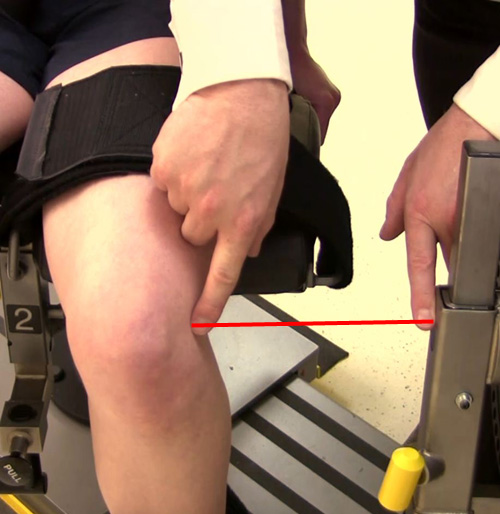
Setting up the machine to get the subject in roughly the right position is only the first part of the task. Do not be afraid to move the seat or dynamometer to allow for better alignment of the biological axis of rotation. At the knee this changes throughout range (so we use a compromise position). Dvir (1995) tells us this extends through the lateral femoral epicondyle (although alignment with the lateral joint line slightly anteriorly to the centre point generally offers better alignment throughout range see below). To check the alignment simply straighten and bend the knee and make sure that the attachment on the calf does not move up and down the shin (this can cause friction burns and does not allow the knee to rotate correctly).
If you find it hard to set the alignment correctly with the knee bent try doing it with it straight this often helps.
Subjects with limited extension will often lift their thigh from the seat as they reach terminal extension setting the axis of rotation slightly too far forwards (towards the patella) can help overcome this.
Small errors in alignment can be compensated for by the subject i.e. if you test the alignment and find the subject moves their body in the chair slightly continue to bend and straighten the knee until they stop adjusting and the alignment will be correct.
Anatomical zero:
With knee straight.
Range of motion:
For flexion try to be between 75-90 degrees of flexion. Then set the range of motion for extension (do not test beyond 0 degrees extension as an absolute maximum, whilst subjects tend to find limitations beyond 5 degrees of flexion irritating and they will tend to do large isometric contractions to try to complete the range).
Gravity correction:
As the lever arm can be very long and heavy in these movements setting of gravity correction is essential. The effects of gravity help the hamstrings but hinder the quadriceps, however, if you always test the same person without gravity correction your results will be generally consistent (as long as the subject does not gain or loose allot of weight! Watch out for heavy and light footwear).
Speeds:
A medium joint speed for testing strength which is 1 degree per second for every 1 degree range of motion (think of it like this if we have already set a range of motion from 0 degrees extension to say 90 degrees flexion then a medium speed would be 90 degrees per second!). However, in the knee some speeds have been used allot in the research these are 60, 90 and 120 degrees per second for strength and 240, 300 and upwards for endurance. So simply choose one of these speeds to suit your requirements.
The range of angular velocities used to test the hamstrings and the quadriceps is extensive. Borges (1989) chose an extremely low value of 12 degrees/second for one of the criterion velocities, whilst at the other end of the spectrum Ghena et al (1991) and Hall and Roofner (1991) tested subjects at velocities as high as 500 degrees/second. It is debatable whether the use of high velocities in knee testing gives significant data for interpretation. A high velocity at the knee is considered to be above 180 degrees/second. Some studies (Ghena et al (1991) being the most significant) have demonstrated only very small strength differences above 300 degrees/second at the knee. The greatest change in muscular strength tends to occur between 30 degrees/second and 120 degrees/second.
The findings of Hall and Roofner (1991) have revealed a moment angular velocity curve which may be easily extrapolated to give predictions of strength values at high values for most normal subjects. It would seem then that testing at very high velocities would provide no useful information to the clinician. However, there may be good reason to test and train at high speed for muscle performance for professional athletes. In fact muscle conditioning at velocities around 450 degrees/second may still constitute a genuine stimulus to the muscle, as has been recommended by Mangine and Noyes (1992).
Any speed between 60 degrees/second and 180 degrees/second would generally meet most requirements for validity and the need for information about muscle performance. Between these ranges the subject tends to be comfortable and finds the movement reasonably easy to cope with. An added benefit is the very wide usage of these speeds in hundreds of studies. Very low and very high velocities are often contraindicated in most patients unless the purpose of the test is to provoke a specific reaction (testing at speeds outside the range of 60-180 degrees/second should be reserved only for professional athletes or very experienced clinicians).
Generally it is accepted that speeds of 60 degrees/second and multiples of this should be used.
Knee Flexion / Extension Protocols:
Muscles involved:
Hamstrings and quadriceps
| Strength Test Protocols | General | Patients | Athletes | Research |
| Contraction Cycle | con/con | con/con | con/concon/ecc | con/conecc/ecc |
| Speed/s | 60 or 120 | 60 or 120 | 60-300 | 60-500 |
| Trial Repetitions | 0 | 0 | 0 | 3 |
| Repetitions | 10 | 10 | 10 | 5 |
| Sets | 3 | 3 | 4 | up to 9 |
| Rest between sets | 20-30 secs | 20-30 secs | 20-30 secs | 20 secs |
| Rest between speeds | 2 minutes | 2 minutes | 2 minutes | 2-5 minutes |
| Rest between sides | 5 minutes | 5 minutes | 5 minutes | 5 minutes |
| Feedback | nil | nil | nil | nil |
| Endurance Test Protocols | General | Patients | Athletes | Research |
| Contraction Cycle | con/con | con/con | con/concon/ecc | con/conecc/ecc |
| Speed/s | 120 | 120 | 120-300 | 120-500 |
| Trial Repetitions | 0 | 0 | 0 | 0 |
| Repetitions | Max | Max | Max | Max |
| Sets | 1 | 1 | 1 | 1 |
| Rest between sets | N\A | N/A | N/A | N/A |
| Rest between speeds | 10-15 mins | 10-15 mins | 10-15 mins | 10-30 mins |
| Rest between sides | 5 mins | 5 mins | 5 mins | 5 mins |
| Feedback | nil | nil | nil | nil |
| Strength Exercise Protocol | General | Patients | Athletes |
| Contraction Cycle | con/con | con/con | con/ecc |
| Speed/s | 60 up to 180 | 60 up to 180 | 60-300 |
| Trial Repetitions | 0 | 0 | 0 |
| Repetitions | 10 | 10 | 14 |
| Sets | 6 | 6 | up to 12 |
| Rest between sets | 30-60 secs | 30-60 secs | 30 secs |
| Rest between speeds | 2 mins | 2 mins | 2 mins |
| Rest between sides | Nil | Nil | Nil |
| Feedback | bar | bar | bar |
| Endurance Exercise Protocol | General | Patients | Athletes |
| Contraction Cycle | con/con | con/con | con/con |
| Speed/s | 120-180 | 120-180 | 120-300 |
| Trial Repetitions | 0 | 0 | 0 |
| Repetitions | Max | Max | Max |
| Sets | 1-3 | 1 | 1-3 |
| Rest between sets | 5-10 mins | N/A | 5-10 mins |
| Rest between speeds | 10-30 mins | N/A | 10-30 mins |
| Rest between sides | Nil | Nil | Nil |
| Feedback | bar/pie chart | bar/pie chart | bar/pie chart |
Notes:
Test the uninvolved or dominant limb first.
Interpretation:
In the knee it is normal to look at the ratio between the right and left sides there should be a 0-10% difference between the sides. Anything beyond this would indicate a muscle imbalance which would be best corrected.
Eccentric results are generally 30% higher than concentric within the quads but are often equal to concentric results in the hamstrings of men and often below concentric in the hamstrings in women.
Generally the quadriceps will be twice the strength of the hamstrings I.e. hamstrings are 50% of quads ham/quad ratio is 50%. In athletes this can change to as high as 80% in long distance type events to 30% in sprinting type events.
Angle of peak torque for flexion is 30 degrees flexion.
Angle of peak torque for extension 70 degrees of flexion.
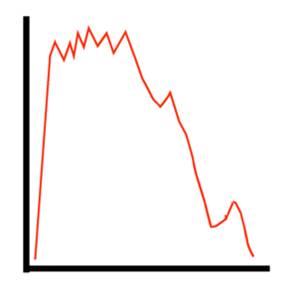
Mensical Dysfunction (torn cartilage):
A double hump (M shape) will often be seen (see below) in people with meniscal dysfunction.
This is probably due to impingement during normal joint motion and reflex inhibition.
Think of it like this:
The joint surfaces rotate around within the menisci.
As the knee is extended / flexed a point is reached where the damaged meniscus is under alot of pressure from the joint surfaces. Of not the dip is normally seen in concentric results in one contraction cycle only.
The meniscus reacts with pain inhibition which temprarily turns off the muscles.
This gives the dip (and is often only seen ever third repetition).
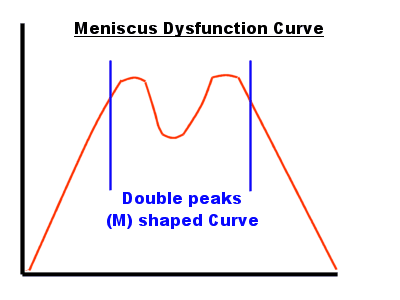
Generally the peak torque will be lower.
It must be stressed that normal isokinetic test results do not exclude meniscal pathology.
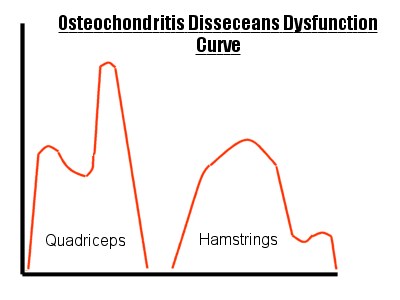
Osteochondritis:
Opposite curve deformations are often seen in the hamstrings and quadriceps curve data. See below.
This is probably a reflection of the pain experienced during the movement and is present in both curves at the same point in ROM because the articular surfaces are involved.
The torque curve deviation will be almost repeated throughout the repetitions.
This is seen more recently in articular cartilage damage. It often remains following chondroplasty or micro fracture demonstrating the surgery has not significantly affected the mechanics of the knee.
Patello Femoral Joint (anterior knee pain):
One of the most common problems at the knee is what has loosely been described as anterior knee pain. This term encompasses a huge range of syndromes and is most effectively treated conservatively.
As Insall (1981) and others have shown the muscular factors involved with patello-femoral joint dysfunction are of considerable importance. Quite why conditioning the quadriceps alleviates pain is not entirely known but its efficacy is unquestionable. Many authors have stressed the importance of an imbalance between the moments generated by the vastus medialis obliquus and vastus lateralis. Unfortunately there remains no reliable way of testing the balance between the VM and VL. EMG could be considered to be semi-quantitative and there are thousands of studies examining the EMG ratio between VL and VM.
Patello Femoral Joint (PFJ) & Isokinetics
When we test the quadriceps isokinetically in patients with PFJ dysfunction there is a definite dependence on the test velocity. This is evident in both the strength scores and in the shape of the MAP curve (enhanced in the lower testing velocities).
Testing for PFJ dysfunction was marred in the early years by researchers such as Elton et al (1985) and Macyntyre et al (1988) as they carried out tests which revealed no significant differences in either concentric or eccentric strength.
Unfortunately both studies involved the use of high angular velocities (180 and 200 degrees/second respectively). At high speed the joint is exposed for a much shorter time to the force which in turn creates a lower load on the joint and hence reduces potential inhibition. At high speeds it could also be argued that the reflex arc may be too slow to inhibit the quadriceps.
Tests performed at the lower velocities were different. Hoke et al (1983) used a test velocity of 30 degrees/second and showed that quadriceps strength and curves were significantly different to the unaffected side. Nordgren et al (1983) also performed tests at low velocities (6, 12 and 60 degrees/second). They found that both men and women demonstrated high reductions in quadriceps strength (22% in men and 34% in women). These findings were further validated by Dvir et al (1990) who found strength reductions of 27% in men and 35% in women concentrically and 44% in women and 41% in men eccentrically. If these findings had been made in 1985 by Elton et al it could be speculated that validation of isokinetic testing over arthroscopy for the diagnosis of chondro malacia patellae would have been made.
Testing at low velocities should be restricted to sets of no more than 6 repetitions performed maximally and reassessed every 2-3 weeks otherwise further symptoms may be invoked by testing.
Pain and Load
Many studies (including Dvir et al, 1991a) have shown that variations in pain score do not correspond with variations in strength.
Pain and load, however, showed strong correlations (load is the product of the magnitude of the moment and the period of time of exposure). Eccentric contractions demonstrate this more readily than concentric contractions. There are two reasons often cited for this.
Higher moment is generated during eccentric contraction.
Patella kinematics
(during concentric contraction the contact area within the patello-femoral notch diminishes yet with eccentric extension the knee flexes and hence the contact area becomes larger. This may be seen as a misnomer as with increased contact comes improved pressure distribution).
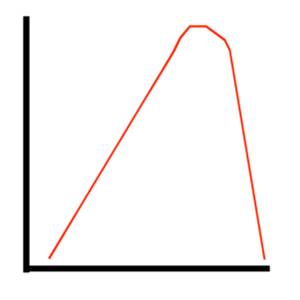
The Moment Curve
Basically a perfect moment curve from an unaffected joint muscle unit with good neuromuscular facilitation should have a curve which looks like an inverted ‘U’ seen here.
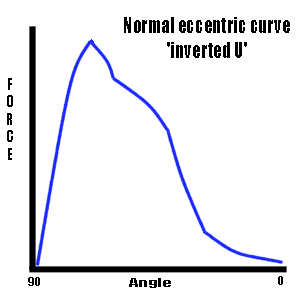
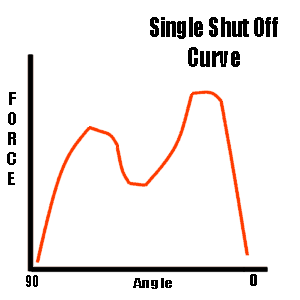
If there is a sudden shut off of the contractile activity this curve assumes an irregular shape. Hart et al. (1985) has shown a common oscillatory phenomenon. In our example we refer to a single (but this could even be a double, triple etc.) conspicuous peak in the curve.
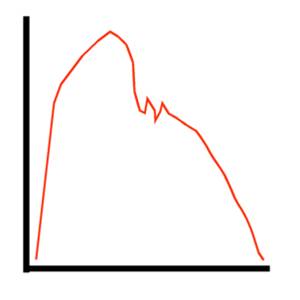
The Break Phenomenon
This is a widely disputed expression of PFJ dysfunction. It was first observed by Nordgren et al. (1983) who took 3 different moment curves on the same patients (preoperatively, under intra-articular anesthesia and during rehabilitation). The first real analysis of the phenomenon was done by Dvir et al. (1991b). They described the break phenomenon as a perturbation in the curve which exceeded a drop of 10% or more (an example of a break curve appears below).
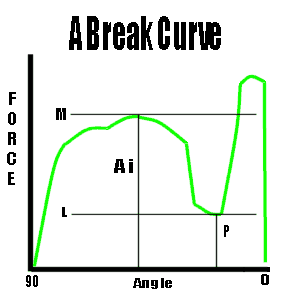
In our example M = the maximum pre break force and L = the lowest recorded force during break. A i = the angle of break and P = the angle of lowest force.
Breaks occur exclusively during eccentric contractions and seem to be associated with a relief of pain at the same moment. This tends to be at about 45 degrees of flexion (reported by Dvir et al. 1991a and Hart et al. 1985). Interestingly, 75 degrees has been calculated to be the point of maximal PFJ reaction force.
Concentric loads at 30 degrees/second are actually greater than eccentric loads at 60 degrees/second but concentric loads do not demonstrate breaks. We could speculate that the load is not responsible of the break phenomenon which could only leave the velocity of movement responsible.
Most breaks can be seen at 30 degrees/second. Lower test velocities than this tend to have exceedingly long exposures and hence the velocity relationship is more constant masking the break.
PFJ Dysfunction Assessment Model
Use of the isokinetic machine to diagnose anterior knee pain as PFJ dysfunction has been the subject of a lot of research (most of which still needs validation). Dvir and Halpirin (1992) looked at assigning a positive and negative value to certain symptoms according to certain criteria.
Every subject was classified according to the following triad.
Strength +/-
Pain +/-
Break +/-
This would give a 3 point description e.g. ‘++-‘. This would mean that the subject demonstrated significant strength reduction (over 20%), pain (modified Borg scale over 0) but no break phenomenon.
A relatively high proportion of the patients tested (27%) have been found to classify as negative on all factors and 24% of subjects were classified as positive on all factors. 40% classified as 2 positives and one negative the rest classified as 2 negatives and a positive (or unable to complete the test!).
The 40% value was found to reflect the accuracy of all other clinical tests. This would suggest that no other accepted test for diagnosing anterior knee pain as PFJ dysfunction is any more accurate than the isokinetic test (if in doubt test isokinetically).
Conclusion
Isokinetic tests can be used to diagnose PFJ dysfunction and monitor treatment progress
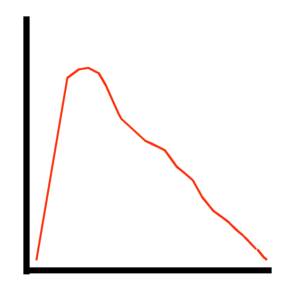
Anterior cruciate ligament (ACL) deficiency:
There is usually a plateau or double peak that occurs in the midportion of knee extension. See below.
This is because the ACL controls a portion of the glide and rotation during mid range knee extension.
Think of it like this:
The quadriceps pull which shears the tibia forwards.
The ACL is unable to control the movement and by reflex turns off the quadriceps temporarily.
This gives the dip which is corrected for by further quadriceps activity.
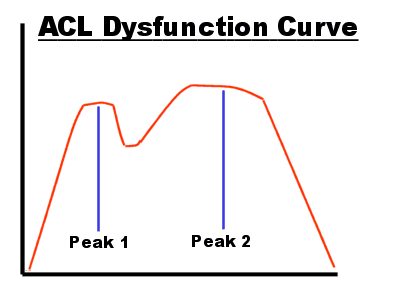
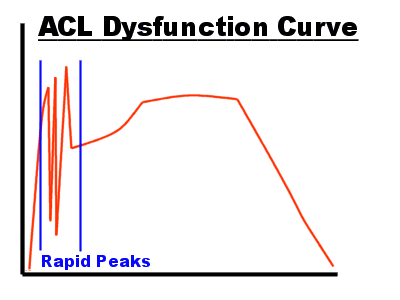
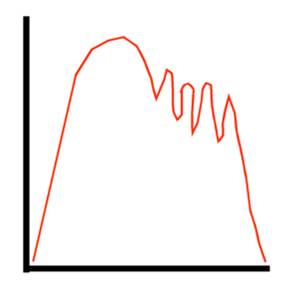
With ACL deficiency there are often three rapid spikes in the early part of the hamstring curve (see below) I hypothesise that this is due to reflex inhibition.
Think of it like this:
The knee is fully extended and the hamstrings pull to bend it.
This trigers an eccentric reflex from the quadriceps which causeses an anterior tibial shear.
This creates a reflex inhibition from the ACL as it is unable to fully control the movement.
This turns off the hamstrings giving a peak and dip in the graph.
The cycle is repeated.
Ohkoshi et al. (1998) found after tendon harvest at all isokinetic speeds more than 80% of cases showed a change in curve shape with no peak in the later half, and a shifted early peak. This reflected a change in the peak torque angle during flexion of the donor knee.
Normal Hamstring Curve:
Early Peak in Hamstring Curve:
Ikeda H, Kurosawa, and Kim (2002) looked at strength and torque curves in ACL deficient knees these are the curves they described.
Erratic First Curve.
Concave Mid Section (eccentric).
Ayalon, Barak, and Rubinstein (2002) did a qualitative analysis of the isokinetic moment curve of the knee extensors following ACL reconstruction. They found that after three weeks of isokinetic exercise the torque curve of the quadriceps concentrically improved to such a degree that it was noticeable to the human eye. They concluded that analysis of the torque curve was a valuable tool following ACL reconstruction. The original torque curves often looked like the one below.
Erratic Last 30 Degrees.
Normative values:
Figures for male athletes.
| Muscle Group | Mode | Angular Velocity | Mean Peak Moments Nm (SD) |
| Extensors | Concentric | 60 | 260 (59) |
| Concentric | 120 | 219 (40) | |
| Concentric | 300 | 146 (27) | |
| Concentric | 450 | 113 (20) | |
| Eccentric | 60 | 257 (36) | |
| Eccentric | 120 | 260 (38) | |
| Flexors | Concentric | 60 | 142 (28) |
| Concentric | 120 | 126 (24) | |
| Concentric | 300 | 88 (20) | |
| Concentric | 450 | 92 (27) | |
| Eccentric | 60 | 166 (40) | |
| Eccentric | 120 | 168 (39) |
Based on Ghena et al (1991).
| Concentric | Eccentric | |||||
| Peak Moment | Extensors | Flexors | Extensors | Flexors | ||
| Women | ||||||
| 15-24 years | 2.19 | 0.87 | 2.37 | 1.06 | ||
| 25-34 years | 1.98 | 0.85 | 2.36 | 1.11 | ||
| Pooled | 2.12 | 0.85 | 2.36 | 1.06 | ||
| Men | ||||||
| 15-24 years | 2.98 | 1.21 | 3.09 | 1.44 | ||
| 25-34 years | 2.49 | 1.08 | 2.67 | 1.37 | ||
| Pooled | 2.76 | 1.16 | 2.88 | 1.4 | ||
| Average moment | ||||||
| Women | ||||||
| 15-24 years | 1.26 | 0.59 | 1.31 | 0.7 | ||
| 25-34 years | 1.22 | 0.58 | 1.38 | 0.7 | ||
| Pooled | 1.25 | 0.58 | 1.34 | 0.7 | ||
| Men | ||||||
| 15-24 years | 1.78 | 0.85 | 1.87 | 1.01 | ||
| 25-34 years | 1.48 | 0.73 | 1.71 | 0.95 | ||
| Pooled | 1.66 | 0.8 | 1.81 | 1 | ||
Based on Highgenboten et al (1988)
Normative peak values expressed in Nm
| 120/second | 900/second | 1500/second | ||||||||||||||||||||
| Right | Left | Right | Left | Right | Left | |||||||||||||||||
| Age | Extension | Flexion | Extension | Flexion | Extension | Flexion | Extension | Flexion | Extension | Flexion | Extension | Flexion | ||||||||||
| Women | 20 | 183 (34) | 100 (20) | 172 (31) | 95 (20) | 143 (25) | 68 (21) | 137 (24) | 66 (17 | 110 (18) | 49 (19) | 106 (19) | 46 (16) | |||||||||
| 30 | 169 (34) | 90 (18) | 163 (30) | 88 (18) | 138 (22) | 61 (15) | 134 (20) | 58 (13 | 108 (19) | 46 (14) | 107 (15) | 42 (12) | ||||||||||
| 40 | 172 (28) | 93 (20) | 161 (26) | 91 (18) | 134 (20) | 62 (14) | 131 (20) | 61 (13 | 105 (15) | 46 (14) | 102 (14) | 46 (13) | ||||||||||
| 50 | 153 (30) | 76 (24) | 143 (26) | 75 (20) | 122 (18) | 52 (13) | 114 (17) | 51 (13 | 94 (16) | 36 (13) | 92 (14) | 38 (11) | ||||||||||
| 60 | 145 (20) | 77 (14) | 125 (24) | 74 (17) | 113 (13) | 53 (12) | 99 (15) | 47 (13 | 84 (10) | 38 (11) | 79 (12) | 35 (12) | ||||||||||
| 70 | 128 (28) | 65 (12) | 120 (25) | 59 (13) | 98 (17) | 39 (13) | 93 (15) | 38 (13 | 74 (12) | 28 (8) | 70 (11) | 25 (9) | ||||||||||
| Men | 20 | 289 (44) | 155 (28) | 269 (47) | 144 (27) | 231 (32) | 122 (21) | 217 (27) | 113 (21 | 180 (24) | 96 (19) | 179 (22) | 91 (19) | |||||||||
| 30 | 258 (45) | 150 (28) | 243 (47) | 143 (35) | 207 (38) | 113 (23) | 196 (35) | 108 (29 | 158 (34) | 91 (26) | 160 (28) | 87 (25) | ||||||||||
| 40 | 248 (29) | 149 (22) | 238 (42) | 144 (24) | 203 (27) | 112 (18) | 197 (31) | 106 (21 | 158 (24) | 87 (16) | 155 (26) | 83 (15) | ||||||||||
| 50 | 226 (51) | 142 (32) | 220 (45) | 129 (30) | 186 (26) | 98 (24) | 177 (32) | 91 (25 | 145 (27) | 82 (23) | 143 (30) | 76 (25) | ||||||||||
| 60 | 223 (48) | 130 (38) | 212 (40) | 133 (34) | 179 (34) | 95 (29) | 169 (32) | 86 (30 | 142 (28) | 78 (24) | 136 (22) | 75 (25) | ||||||||||
| 70 | 188 (36) | 109 (30) | 183 (37) | 109 (32) | 143 (24) | 78 (26) | 145 (30) | 77 (23) | 113 (22) | 61 (23) | 113 (21) | 60 (26) | ||||||||||
From Borges (1989)
Single repetition peak torque to body weight (foot pounds to weight in pounds) ratios for elite junior tennis players.
| Left | Right | |||||
| Male | Female | Male | Female | |||
| Knee extension | ||||||
| Torque/BW 180 | 60.2 | 60.5 | ||||
| Torque/BW 300 | 53.8 | 44.4 | 54 | 47.4 | ||
| Work/BW 180 | 61.4 | 62.1 | ||||
| Work/BW 300 | 54.1 | 43.3 | 52.8 | 42.6 | ||
| Knee flexion | ||||||
| Torque/BW 180 | 36.6 | 36 | ||||
| Torque/BW 300 | 33.7 | 30.7 | 32.6 | 31.3 | ||
| Work/BW 180 | 35.2 | 35.2 | 26.5 | |||
| Work/BW 300 | 29.5 | 27.2 | 29.5 | |||
Adapted from Chan an Maffulli (1996). All speeds 0/second.
Hamstring / quadriceps ratios for male and female junior tennis players.
| Left | Right | |
| Male | ||
| H/Q 180 | 61% | 59% |
| H/Q 300 | 63% | 62% |
| Female | ||
| H/Q 300 | 69% | 66% |
Adapted from Chan and Muffulli (1996) All speeds 0/second.
Hamstring / quadriceps peak torque ratio (dominant side)
| 600/second | 1800/second | |
| Control | 58% | 45% |
| Badminton | 48% | 52% |
| Cycling | 45% | 38% |
| Soccer | 63% | 52% |
Adapted from Chan and Maffulli (1996)
Normalised strength at 500/second expressed as peak torque to body weight