Plantar and dorsi flexion are normally performed in either the supine (or modified supine / seated), prone or standing positions.
The ankle poses problems not shared by the knee joint. As it is such a polyarticulating area with a wide variety of movements and allot of muscles spanning it, the ankle throws up many procedural issues, like positioning and alignment, and issues related to closed versus open chain testing.
Plantar and dorsi flexion tests can be used to evaluate strength properties in many different populations but research has focused around sporting populations. In recent years it has become very popular in patient groups with achilles tendon issues (either rupture or tendinitis / tendinosis) as testing can detect eccentric muscle strength issues. This alows specific treatment to be provided for those individuals. The tests are reliable and intraclass coefficient correlation vary from 0.81 to 0.96. (Brown 2005). Most tests are performed in what is known as the closed packed position (that is the knee is straight) concentrating on the gastrocnemius group. Testing in the loose packed (with the knee bent) position focuses on the soleus group, however, both groups are tested in both positions so the influence of position is very much academic.
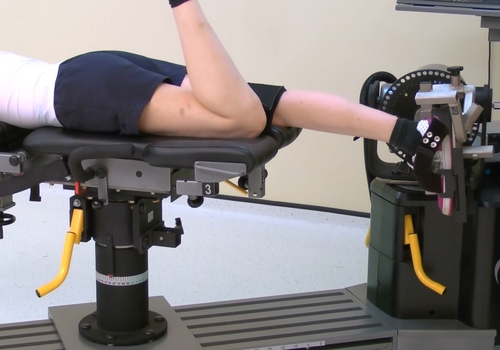
Supine lying position (open pack):
In this position there is the increased innate thoracic and pelvic stability (little rotation occurs). The knee is bent to between 60 and 90 degrees
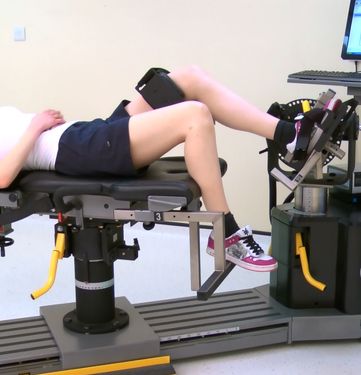
To view a set up video see below:
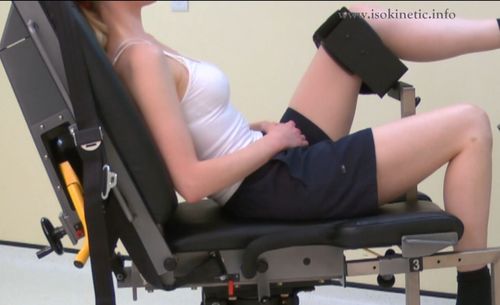
Modified Seated position:
In this position there is even more innate thoracic and pelvic stability and the subject is generally more comfortable. The angle of the knee remains between 60 and 90 degrees. A modified seated position with the knee flexed to 90 degrees seems to be the position of choice in rehabilitation (Backman and Oberg, 1989). Best for patients.
Prone (closed pack).
The prone position best represents the functional position of the leg when used in everyday activities and sport. This has lead it to be referred to as the most functional position. However, there are fundamental stabilisation problems. As the force generated by the calf muscles will often be enough to push the subject up the bed the subject will move rather than the actuator. This will often happen regardless of strapping or holding onto the bed.It has been shown that testing with full knee extension (avoid any flexion or hyper-extension) yields results 10-15% higher than those in sitting. This is due in part to the assistance of the hamstrings to the gastrocnemius muscle. Be careful to ensure the knee is fully supported on the chair otherwise pain can occur due to knee hyper-extension.
To view a set up video see below:
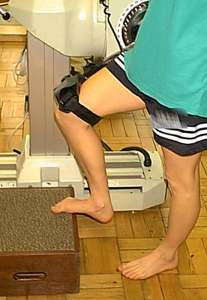
Standing (plantar flexors only):
Testing can be performed for (plantar flexion only) in the more functional position of standing (see below). This offers an excellent ROM and good stability but is harder to position in the first instance and is often not a standard testing position.
Stabilisation:
Seated / modified: In the seated position stabilisation usually involves holding the bed handles. Most manufacturers supply a thigh / calf stabiliser which can be used to limit knee movement (the knee normally tries to rotate inwards). Whether it is used on the calf or thigh make little difference to the test.
Prone: The use of a lap belt and holding the handles is normally the best that can be achieved. If the option of using a thigh strap is available add it to offer better stability.
Standing: None normally required
Attachments:
The footplate supplied with the machine should fully stabilise the foot it is likely the foot will pull to dorsi flexion during the test so car should be used to full tighten any straps
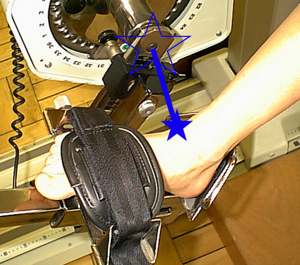
Axis of rotation:
As described by Inman (1976) it is considered to pass through the malleoli (technically this forms an angle with the longitudinal axis of the tibia. Remember the tibia has an offset angle of 10 degrees).
Anatomical zero:
Foot at neutral (as if standing).
Range of motion:
Normal ROM of dorsiflexion is said to be 25 degrees while for plantarflexion it is thought to be 45-50 degrees (Miller, 1985) Figures range for both movements to ridiculous values, however, most people agree on one thing. The neutral position is equal to 0 degrees. To give you an idea of the functional ROM during walking there is approximately 10 degrees dorsiflexion to 20 degrees plantarlexion (Mcpoil and Knecht, 1985) whilst during running there is approximately 20 degrees dorsiflexion to 25 degrees plantarflexion (Soutas-Little et al., 1987). On this basis ROM over 45 degrees should really be avoided unless academic interest lies in this area.
Gravity correction:
The effects of gravity are negligible in this position in fact some manufacturers use a counter balance rather than instrumented correction.
Speeds:
As the ankle is subject to velocities in the region of 150-200 degrees/second whilst walking there has been a propensity to use high speeds whilst testing (Sutherland et al, 1980). Velocities higher than 30-90 degrees/second are not usually required. Peak moment does tend to decline with increasing velocity. The moment at 120 degrees/second will generally be half that at 60 degrees/second. There does, however, appear to be a relationship between mean power and a test velocity of 180 degrees/second as described by Gerdle and Fugl-Meyer (1985).
Generally it is accepted that speeds of 30 degrees/second and multiples of this should be used.
Ankle Plantar / Dorsi Flexion Protocols:
Muscles involved:
Soleus, gastrocnemius and tibialis anterior
| Strength Test Protocols | General | Patients | Athletes | Research |
| Contraction Cycle | con/con | con/con | con/concon/ecc | con/conecc/ecc |
| Speed/s | 45 or 90 | 30 or 45 | 30-300 | 30-500 |
| Trial Repetitions | 0 | 0 | 0 | 3 |
| Repetitions | 10 | 10 | 10 | 5 |
| Sets | 3 | 3 | 4 | up to 9 |
| Rest between sets | 20-30 secs | 20-30 secs | 20-30 secs | 20 secs |
| Rest between speeds | 2 minutes | 2 minutes | 2 minutes | 2-5 minutes |
| Rest between sides | 5 minutes | 5 minutes | 5 minutes | 5 minutes |
| Feedback | nil | nil | nil | nil |
| Endurance Test Protocols | General | Patients | Athletes | Research |
| Contraction Cycle | con/con | con/con | con/concon/ecc | con/conecc/ecc |
| Speed/s | 90 | 90 | 90-300 | 90-500 |
| Trial Repetitions | 0 | 0 | 0 | 0 |
| Repetitions | Max | Max | Max | Max |
| Sets | 1 | 1 | 1 | 1 |
| Rest between sets | N\A | N/A | N/A | N/A |
| Rest between speeds | 10-15 mins | 10-15 mins | 10-15 mins | 10-30 mins |
| Rest between sides | 5 mins | 5 mins | 5 mins | 5 mins |
| Feedback | nil | nil | nil | nil |
| Strength Exercise Protocol | General | Patients | Athletes |
| Contraction Cycle | con/con | con/con | con/ecc |
| Speed/s | 60 up to 180 | 45 up to 180 | 30-300 |
| Trial Repetitions | 0 | 0 | 0 |
| Repetitions | 10 | 10 | 14 |
| Sets | 6 | 6 | up to 12 |
| Rest between sets | 30-60 secs | 30-60 secs | 30 secs |
| Rest between speeds | 2 mins | 2 mins | 2 mins |
| Rest between sides | Nil | Nil | Nil |
| Feedback | bar | bar | bar |
| Endurance Exercise Protocol | General | Patients | Athletes |
| Contraction Cycle | con/con | con/con | con/con |
| Speed/s | 90-180 | 90-180 | 90-300 |
| Trial Repetitions | 0 | 0 | 0 |
| Repetitions | Max | Max | Max |
| Sets | 1-3 | 1 | 1-3 |
| Rest between sets | 5-10 mins | N/A | 5-10 mins |
| Rest between speeds | 10-30 mins | N/A | 10-30 mins |
| Rest between sides | Nil | Nil | Nil |
| Feedback | bar/pie chart | bar/pie chart | bar/pie chart |
Notes:
Test the uninvolved or dominant limb first.
Interpretation:
In the ankle it is normal to look at the ratio between the right and left sides there should be a 0-10% difference between the sides. Anything beyond this would indicate a muscle imbalance which would be best corrected.
Eccentric results are generally 30% higher than concentric within the same muscle. In pathology of the lateral ankle complex the eccentric results can be drastically reduced. Restoration of this imbalance is crucial.
Concentric/concentric: dorsiflexion/plantarflexion ratio should show a plantarflexor dominance of 70-75 percent (Nyska and Mann 2002).
The angle of peak moment has been found by Sjostrom et al. (1978) and Gerdle et al. (1988) to be somewhere around 25 degrees of plantarflexion
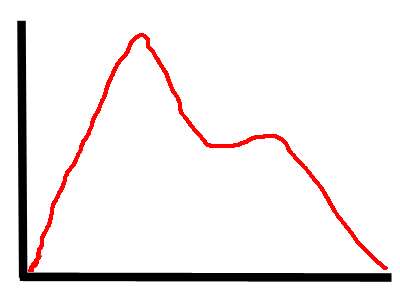
Achilles Tendinitis or Tendinosis or Tendonopathy:
The concentric results often show a peak and then a rapid drop followed by recovery. This is because the tendon is placed under different stresses compared to the leverage through the ankle. The mid range (plantar grade) is most commonly affected as this demonstrates the highest lever disadvantage.
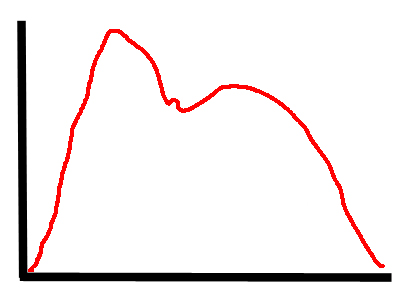
In slow eccentric tests there is often a concave mid section to the results this is most likley due to neural inhibition of the muscle/s to protect the affected structure.
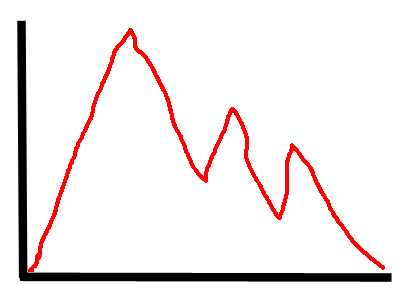
In fast eccentric tests the results often peak but then just demonstrate pain inhibition with very irregular mid to late curve results.
Normative values:
| Davies (1992) seated | Age | Sex | Machine | PTBW | PTBW |
| speed deg/s | M | Cybex | Plantflexion | Dorsiflexion | |
| 60 | 65 | 12 | |||
| 120 | 38 | 9 | |||
| F | |||||
| 60 | 50 | 12 | |||
| 120 | 9 | 8 | |||
| Gehlsen et al. (1991) seated | M | Cybex | PTBW (sd) | PTBW (sd) | |
| 30 | 75.2 (10.8) | 17.5 (2) | |||
| 120 | 40.7 (10.6) | 9.8 (1.2) | |||
| 180 | 29.3 (8.4) | 6.5 (1.5) | |||
| Total work | Total work | ||||
| 180 | 409.3 (133.3) | 74.2 (36.6) | |||
| Biodex Values seated | M | PTBW | PTBW | ||
| 30 | 49-65 | 13-17 | |||
| 60 | 36-48 | 11-15 | |||
| 120 | 23-31 | 9-12 | |||
| F | |||||
| 30 | 43-55 | 16-21 | |||
| 60 | 36-46 | 15-20 | |||
| 120 | 20-26 | 11-14 |
So et al (1994) looked at sports strength results using a Cybex dynamometer:
| 60 degrees per sec | Nonathletic | Cycling | Gymnastics | Soccer | Overall |
| Pt Nm (sd) | |||||
| Plantar flex | 93 (18.8) | 109.7 (19.6) | 83.6 (19.9) | 104.9 (19.4) | 96.4 (20.4) |
| Dorsi flex | 30.2 (4.8) | 24.8 (4.2) | 29.9 (4.3) | 34.4 (5.7) | 30.4 (5.5 |
| PTBW | |||||
| Plantar flex | 156.5 (25.7) | 173.3 (19.9) | 141.7 (36) | 168.1 (26) | 159 (27.8) |
| Dorsi flex | 51.6 (8) | 40 (6.2) | 51.1 (3) | 56.1 (9.3) | 51 (8.7) |
| Peak ratio D/P% | 33.8 (7.1) | 23.3 (3.8) | 37.7 (8.7) | 34 (7.5) | 33 (8) |
| 180 degrees per sec | Nonathletic | Cycling | Gymnastics | Soccer | Overall |
| Peak torque (Nm) | |||||
| Plantar flex | 41.2(10.1) | 46.7(10.3) | 39.7(7.0) | 42.9(11.0) | 42.1(9.8) |
| Dorsi flex | 15.1 (3.3) | 13.3(3.5) | 17.0(2.2) | 17.3(3.9) | 15.7(3.5) |
| PTBW | |||||
| Plantar flex | 69.1(12.9) | 73.7(12.7) | 68.1(13.3) | 69.2(16.0) | 69.6(13.3) |
| Dorsi flex | 26.4(5.7) | 21.8(4.8) | 30.1 (5.0) | 28.5(6.1) | 26.8(5.9) |
| Paek Torque Ratio% | |||||
| Dorsi/plant | 38.5(6.5) | 29.3(3.6) | 44.3(2.6) | 42.6(9.9) | 39.1(7.9) |
| TAE (joules) | |||||
| Plantar flex | 9.0(2.1) | 10.2(2.3) | 9.9(1.4) | 9.7(1.6) | 9.5(1.9) |
| Dorsi flex | 3.7(1.0) | 3.8(1.2) | 5.1(0.6) | 4.6(1.1) | 4.1(1.1) |
| Total work (joules) | |||||
| Plantar flex | 413.4(151.0) | 493.3(153.5) | 411.6(163.6) | 481.2(174.8) | 438.8(157.2) |
| Dorsi flex | 156.2(69.7) | 131.2(59.2) | 222.9(49.3) | 208.1(69.9) | 174.8(71.4) |
| Endurance ratio % | |||||
| Plantar flex | 37.0(11.8) | 43.8(13.1) | 47.0(7.8) | 53.0(9.3) | 41.8(13.9) |
| Dorsi flex | 33.3(12.8) | 33.3(18.8) | 55.4(9.3) | 47.9(14.5) | 40.0(15.9) |
| Average power (watts) | |||||
| Plantar flex | 48.7(17.9) | 62.0(18.6) | 52.1 (16.3) | 60.6(18.5) | 53.7(18.2) |
| Dorsi flex | 17.9(7.7) | 16.0(7.0) | 28.1(4.2) | 26.4(9.4) | 21.1(8.8) |
| Works ratio dorsi/plant% | 38.8(12.2) | 26.2(7.0) | 57.3(9.9) | 47.3(16.5) | 41.9(15.0) |
Values for adductor group concentric and eccentric strength (in Nm). Based on Ivey et al (1985), Cahalan et al (1991) and + Shkiar & Dvir (1994) sedentary subjects.
Dorsiflexor concentric strength (subjects tested supine with full knee extension)
| Female | Male |
| Dorsiflexors | ||
| 30/sec | 26 | 33 |
| 60/sec | 20 | 26 |
| 120/sec | 15 | 18 |
| 180/sec | 12 | 12 |
Plantarflexor concentric strength (subjects tested supine with full knee extension)
| Female | Male |
| Sedentary | Trained | Sedentary | Trained | |
| Plantarflexion | ||||
| 30/sec | 84 | 140 | 126 | 183 |
| 60/sec | 64 | 113 | 96 | 145 |
| 120/sec | 39 | 75 | 60 | 95 |
| 180/sec | 27 | 52 | 41 | 64 |